
A taxi owner earns money by operating the taxi on the road. However, in doing so, the taxi owner also incurs fuel and environmental costs. As owner of any other revenue generating source, this taxi owner would also like to save on fuel/utility costs and protect the environment for a better future. The recent emergence of electric vehicles (EVs) can surely play a role in this regard.
Batteries are not yet ready to replace fuel consumption in refinery or petrochemical plants. Manufacturing plants, in general are also trying hard to conserve energy and reduce emissions. In this blog we will highlight some of the features of a solution from Yokogawa, known as – Visual Mesa (Energy Monitoring) which will help manufacturing plants to achieve their goals regarding Energy Management and Environmental Protection.

Figure-1
As shown in Figure 1, a utility unit provides energy in the form of steam and electricity, and process units consume this energy to produce various products. Unfortunately, no system is 100% efficient. From the viewpoint of energy efficiency, we see heat losses through flue gas and steam lines, including steam traps. Further, flue gas emissions themselves are a matter of concern.
We can imagine that many customers will thus have concerns about effective measures for both producing energy and dealing with emissions. Such measures would involve detecting the source of an issue, solving this issue, and performing maintenance such that this issue does not occur again. However, all these actions win only half the battle. The other half of the battle would be won if these remedial measures would be demonstrably beneficial to not only manufacturers but also society.

Figure-2
Visual MESA-EM (Energy Monitor) is a digital twin that can capture heat losses and emissions using sensors, analyzers, and estimators. These data can be used to determine energy cost impacts and environmental loads. Users can then take corrective actions for saving energy and reducing emissions from a cost viewpoint. Visual MESA-EM also facilitates users in maintaining optimal conditions by visualizing opportunities and then prioritizing and validating them.

Figure-3
Figure 3 shows how energy leakages at furnaces are monitored using Yokogawa’s tunable diode laser spectroscopy (TDLS) approach and Visual MESA-EM.
• TDLS measures the combustion conditions accurately and in real time through the carbon monoxide (CO) and oxygen (O2) contents just above the combustion flare in each furnace. A higher CO content implies fuel-rich conditions, that is, excessive fuel is being supplied to the furnace. By contrast, a higher O2 content implies air-rich conditions, that is, excessive air is being supplied to the furnace, causing a wastage of heat energy.
• Visual MESA-EM displays the target equipment and reports both fuel volume and fuel cost savings based on TDLS measurements of each furnace.
• By using Visual MESA-EM and TDLS, users can identify furnaces in which energy is being wasted and safely adjust the CO:O2 ratio based on real-time data to achieve optimum combustion.
• For example, Yokogawa performed a case study and estimated the following fuel (CH4) cost savings by varying the CO and O2 contents:
• 1% less CO: 10,000 USD per year
• 1% less O2: 5,000 USD per year

Figure-4
Figure 4 shows how Predictive Emission Monitoring Estimation (PEMS) and Visual MESA-EM work in combination.
• PEMS estimates current emissions based on real-time peripheral process data.
• Visual MESA-EM calculates and displays specific environmental KPIs (e.g. specific emissions by specific equipment which includes energy consumption, energy cost, and production volume in report form).
Through the combined use of PEMS and Visual MESA-EM, the users can determine the following:
• high environmental load equipment and its operation
• best operating conditions to meet environmental regulations while minimizing energy losses
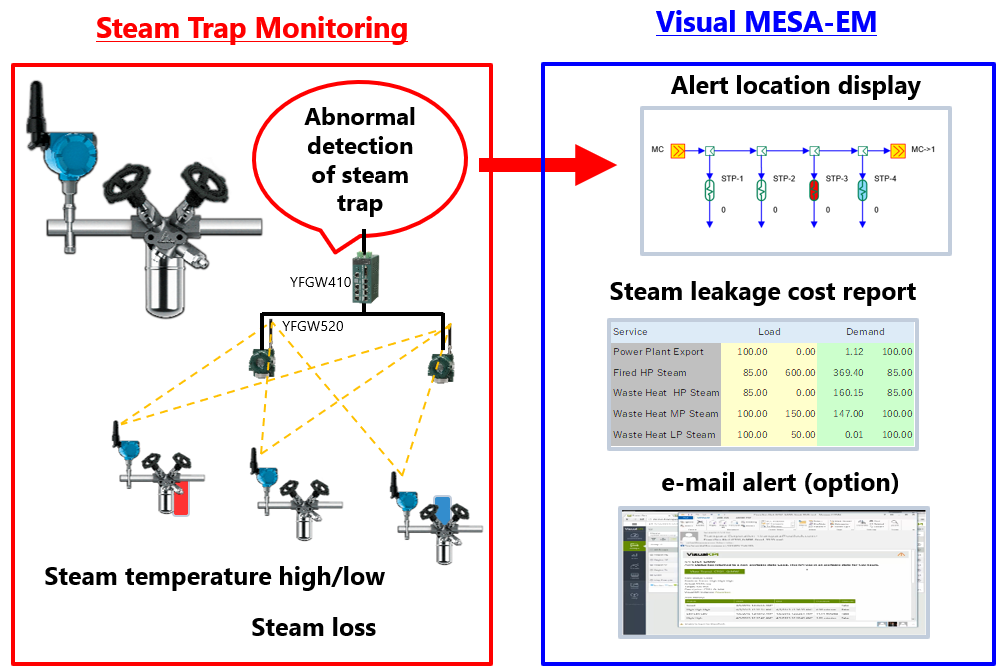
Figure-5
Figure 5 shows how Steam Trap monitoring and Visual MESA-EM work in combination. This solution comes with optional software.
• In Steam Trap monitoring, wireless steam trap sensors detect the steam trap temperature and provide one of three readings:
• OK – Normal condition
• Cold – Clogged condition
• Blow-Thru – Hot/Leakage condition
This reading is provided along with the steam leakage volume to Visual MESA-EM.
• Visual MESA-EM displays the steam trap condition on the energy monitor and reports the steam leakage cost under a variable energy cost.
• The Visual MESA-EM software sends an e-mail alert identifying the problematic steam trap(s) with a link to the enhanced KPI dashboard.
• By referring to the e-mail alert, remote users can understand the steam trap condition and take proper remedial measures.
Unlike with previous routine checks of steam traps, users can now detect steam trap problems immediately and can prevent steam leakage. Yokogawa performed a case study and estimated savings of over USD 1 million in a system with many steam traps.
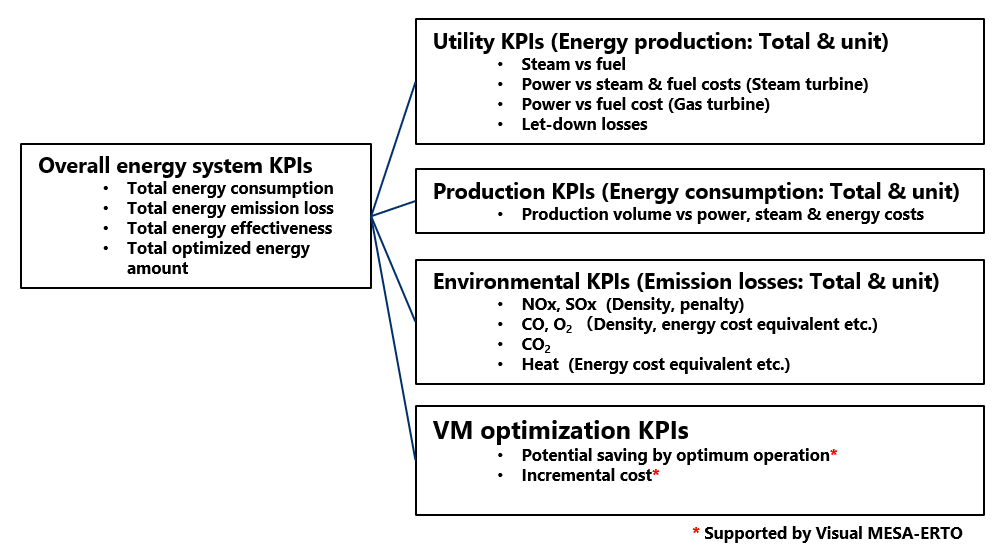
Figure-6
Figure 6 shows how various KPIs contribute to the overall energy system KPIs. These KPIs are general ones that are shown as an example. They can be monitored using Visual MESA-EM. Yokogawa’s KPI calculation and management solutions are as follows:
• Review all energy optimization results and calculate overall energy system KPIs such as energy production, energy usage, and emissions
• Allow benchmarking with competitors in terms of energy units
• Use KPI data for continuous improvement of energy management according to the ISO 50001 standard.
• Use KPI data in a company’s balanced scorecard (BSC)
If Visual MESA-ERTO (Energy Real-Time Optimizer) is used, the benefits mentioned under “VM optimization KPIs” in the figure can also be enjoyed.

Figure-7
Figure 7 shows the Visual MESA-EM dashboard, in which all values can be seen and KPI trends can be monitored. The system periodically displays a KPI report.

Figure-8
Figure 8 shows how Visual MESA-EM can be upgraded to Visual MESA-ERTO to realize optimum operation. EM and ERTO differ in that ERTO issues optimum operation guidance for the open-loop system to operators along with the following information:
• optimal boiler load
• optimal steam turbine load and steam turbine power generation
• optimal gas turbine load and gas turbine power generation
• optimal fuel usage
• optimal power import amount
By following this guidance, Yokogawa found that energy costs could be reduced by 2%–5%.
By contrast, in a closed-loop system, VM-ECLRTO (Energy Closed-Loop Real-Time Optimizer) automatically implements optimum set points in the control system to reduce the operators’ load.

Figure-9
Figure 9 shows how Visual MESA-EM can be upgraded to Visual MESA-MPO (Multi-Period Optimizer). Visual MESA-MPO offers optimum planning and scheduling for energy systems. To minimize energy costs in a certain term, both operational as well as time-dependent constraints must be considered. Such constraints may be related to the following issues:
• planned out-of-service period
• emissions caps
• fuel tank farm management
• minimum/maximum start/stop time of equipment
• thermal energy storage management
In Figure 9, Case 1 shows gas turbine operation scheduling. A gas turbine and imported power from a grid satisfy the overall power demand of the plant. In this case, one could assume that the gas turbine should be switched off if the power import price is low. However, this would be a suboptimal choice because the gas turbine has a “minimum downtime” that is a time-dependent constraint. Owing to this constraint, the opportunity of using the gas turbine for power generation when the import power price becomes higher than the price of power generated using the gas turbine would be missed. When any equipment has such a constraint, running the equipment at the lowest load is optimal.
In Figure 9, Case 2 shows oil tank operation. One of the three boilers uses byproduct fuel oil such as residue oil. During typical operation, the oil tank level is maintained at a fixed point. By increasing the inventory capacity and using the stored oil, energy import can be reduced when the energy import cost is high. Visual MESA-MPO suggests when oil should be stored and when it should be released in consideration of the future energy price and energy demand.
These two simple cases demonstrate how Visual MESA-MPO can afford cost savings through accurate planning and scheduling for energy systems.
The automobile sector is using recent technological advancements to develop specialized systems to reduce fuel consumption and emissions. Further, EVs have been developed and are becoming increasingly popular. The manufacturing sector similarly needs to exploit the latest technology to reduce energy consumption and emissions and thereby become sustainable in the long term. Manufacturing plants could enjoy benefits such as energy cost savings and reduce emissions to protect the environment for present and future generations.

about the author