
The number one priority of oil and gas companies is always safety. Today the second priority is emissions reduction. Many of the AI use cases I will discuss help make plants safer and more sustainable. In this Blog I will focus on AI, but this is enabled by the vast amount of data generated by traditional systems and now the internet of things and the vast computing resources available to process it.
Yokogawa and KBC`s consulting is based on a model of Operational Excellence for oil, gas and chemicals companies. Our approach to the application of digital technologies is to work backwards from the business goals, constraints, best practices and users to define the Digitalization technologies and approach to deliver on business outcomes, rather than start with new technologies and look for places to apply them.
Digital solutions should support all areas of operational excellence and the overall corporate goals or maintaining the license to operate, increasing margins and optimizing the capital employed.
Key to the progression towards autonomous operations is the combination of traditional automation technologies such as modular procedure automation, multivariable predictive control and process optimization with the latest AI and machine learning technologies.

Figure 1
There are many areas to consider when implementing the latest digital technologies.

Figure 2
Digital transformation starts right at the beginning of the asset lifecycle with process simulation. The use of standard schemas such as the Proteus XML Schema which is part of ISO 15926 can form the foundation of the asset knowledge graph and the management of asset knowledge.
Ontologies can be used to convert P&ID data and steady state simulations into a semantic model which can then be used to create dynamic simulations, control and safety system configuration and logic and ultimately the knowledge graph for the asset.

Figure 3
Our semantic model broker uses the Proteus xml schema which is part of the ISO 15926 standard for digital data exchange of process design data. The broker reads P&ID data and a steady state simulation model to create a knowledge graph which represents the design of the physical asset. A knowledge graph is the technology used by Google and others to organize all the information on the internet. It can also be used for Enterprise Data management.

Figure 4
Another use of 3d design data is to create 3d schematics. These are used to train field operators and maintenance personnel. And in future can be used to provide augmented reality in the field and perhaps in future by robots to carry out field work particularly in hazardous areas.

Figure 5
The current state of the art in value chain optimization has not changed significantly in the last couple of decades. Linear programs are used for planning, event-based simulation for scheduling. The models used are based on regressions of plant data or simulation models. Model maintenance is manual and time consuming. Variance analysis to compare the actual operation with the plan is done weeks after the fact and is also manual and time consuming.
In many cases the integration between planning, scheduling, optimization and control is poor.
In the best facilities first principle models are widely used but the effort required to maintain them is high.
There are significant improvements that can be made to the applications used in each part of the process and the integration between the applications and the business processes using the latest digital technology.
Today’s optimization processes are highly manual and dependent on skilled process engineers with subject matter expertise.
Linear planning models have a limited range of validity, so companies are trying to add non-linearity but not at a cost to the speed.
Updating and synchronizing each of the applications in the process, LP and scheduling models is time-consuming and SME dependent, so developments are looking at the UX, but not compromising the accuracy.
There is a largely heuristic data reconciliation process, which takes time to gain the experience needed to eliminate errors. Development is going on to automate this task.
Data is still siloed and difficult to manage, meaning result verification slows the process.
Due to the multiple steps there is slow recognition of opportunities to open constraints. Currently they are managed with experience and expertise, development is focused on the speed and scope of the optimization solution.
Control strategies not updated with schedule changes – this is where the results and analysis are not implemented fully. Development is focused on automating the scheduling process and adding more optimization.
Data driven operation requires the use of artificial intelligence to better use the vast amounts of data available in our industry. Some of the use cases of AI include (figure-5)
1. Better collection and management and visualization of supply chain data using IIoT and knowledge graphs,
2. Better forecasting of demand and prices
3. Automated variance analysis, data reconciliation and opportunity identification
4. Automatic model updates
5. Improved scheduling with more optimization
6. Asset wide rather than unit optimization
7. Cognitive operations to support operations and maintenance.
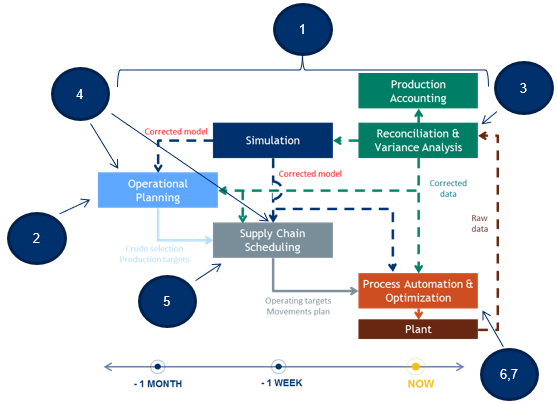
Figure 6
Semantic web technologies such as knowledge graphs are making data machine-readable and integrating data silos. Google uses knowledge graphs to manage the world wide web and improve its search applications. This technology is now being applied to enterprise knowledge management and it key to reducing the data and organizational silos. It can enable visualization and optimization across the entire value chain. It can add structure to unstructured data in spreadsheets and documents. It is key to supporting the use of natural language processing and other AI to add meaning to data. It enables enterprise search and chatbots.

Figure 7
As Mathematics modeling is evolving very fast, Machine Learning is gradually becoming the simpler alternative for complex concepts from physics.
Traditional RTO applications use open form first principles models on-line and in closed loop. These applications are expensive to develop and difficult to maintain and so are not widely used.
We are working with a client to use a combination of plant data and optimized simulation data to train machine learning models. The existing multivariable controller does a good job of maximizing the yield of distillate subject to the product quality and other constraints. However, it does not do a good job of optimizing the energy variables such as stripping steam, pump-around duties and coil outlet temperature.
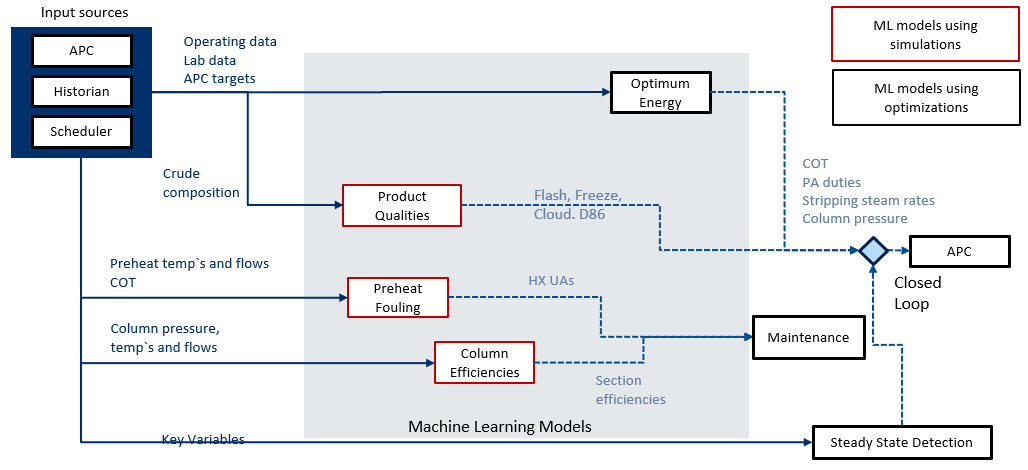
Figure 8
Making Machine Learning as an alternative, Historical operating data is reconciled and used to create a baseline simulation. The simulation is then optimized, and the resulting synthetic data is regressed to create the ML model. The ML model can then determine the optimum targets for the energy variables based on the feed quality and the column operation at any point in time.

Figure 9
Machine learning and first principles models can also be used to compare actual operation with the simulated operation and with the planned operation. This variance analysis is currently typically done a few weeks after the end of each month. It is a manual process and it often not done rigorously. By comparing data between facilities and over a large period it is possible to automate the identification and prioritization of profit improvement opportunities.
The current state of the art of production scheduling is to use event-based simulation to determine a feasible schedule based on the operating plan. This is a highly manual process which often requires a team of schedulers. There is limited time to model different scenarios or to find the optimum schedule.
Machine learning can be added to the existing scheduling application, firstly by automating the update of the schedule from the latest inventory and movement data using supervised learning to determine the likely cause of inventory discrepancies, and secondly using reinforcement learning to adjust the schedule to minimize constraint violations and deviations from plan.
In this case the environment is the event-based simulation and the state can be defined by the quality and volume in each tank, the production rates and constraint values at any point in time. The reward can be a function of the gross margin, constraint violations, deviations from plan and changes in inventory.
The actions are the scheduled tasks.

Figure 10
Autonomous operation requires the novel combination of several mature and novel technologies including:
Rigorous simulation
Multivariable predictive control
Modular procedure automation
Knowledge graphs
Machine learning
Symbolic AI
Initially these technologies will complement the operations team but, in the future, autonomous operation may be possible.

Figure 11
The next blog explains Digital Transformation at early stages of Asset Lifecycle, and we will see that how Artificial Intelligence (AI) is utilizing vast data available with the industry and lead operations toward Autonomous Operations (Towards Autonomous Operations of Hydrocarbon Processing – Part 2)
*This blog is based on webinar presented by Simon Rogers, Vice President, Digital Solutions at Yokogawa