

KPI – Key Performance Indicator: very often we hear this word whenever we join management level meetings, technical meetings, during discussions with operation managers and operators, etc. Each of them has a different set of KPIs, but the goal for everyone is to provide maximum benefit to their manufacturing plant.
In 2019, after visiting more than 50 manufacturing plants, Yokogawa came up with the solution, PDO: Profit Driven Operation. Yokogawa designed this new concept by creating a metrics that connects Business KPIs with Operations KPIs. Not only was this metrics created, but also created was a Dashboard that easily depicts the pain points that need immediate attention. All of this is not the end of Yokogawa’s Engineers’ dedication to support their clients, for they have added AI and Machine Learning features to this PDO, which helps leaders, managers, engineers, and operators to take preventive actions before something goes beyond their control.

Figure-1
Yokogawa defines the KPI metrics based on layers of organization and their management objectives, calling it SPI metrics (as demonstrated in Figure 2). SPIs (Synaptic Performance Indicator) are designed with the consideration of relationships and trade-offs between Operations KPIs.
Based on Yokogawa’s investigation, SPI metrics are formed with five business objectives: production, profit, energy, RAM (Reliability/Availability/Maintainability), and safety; and these business objectives are shared among four categories based on roles: leadership, management, technical, and operations.

Figure-2: Metrics based on business objectives and roles
In detail, production SPIs are related to process utilization and production plan achievement. Profit SPIs are related to an increase of a higher price product and reduction of production cost. Energy SPIs are related to reduction of energy cost and quality giveaway. RAM SPIs are related to asset availability and maintenance cost. Safety SPIs are related to safety and environment.
Based on the role, the business objectives are distributed and shared, so that as a whole, a manufacturing plant achieves its objectives on time.

Figure-3
PDO is available on all control systems via OPC interface or Vnet/IP interface, and it displays various types of SPI dashboards on the web browser or CENTUM HIS graphic.
PDO sends a performance alarm when an SPI value goes out of High/Low operational limits.
PDO displays predefined expert guidance how to recover from the performance alarm. This helps engineers and operators to identify the root cause and to take prompt, appropriate action.
PDO servers store long-term SPI history for later performance analytics or benchmarks.
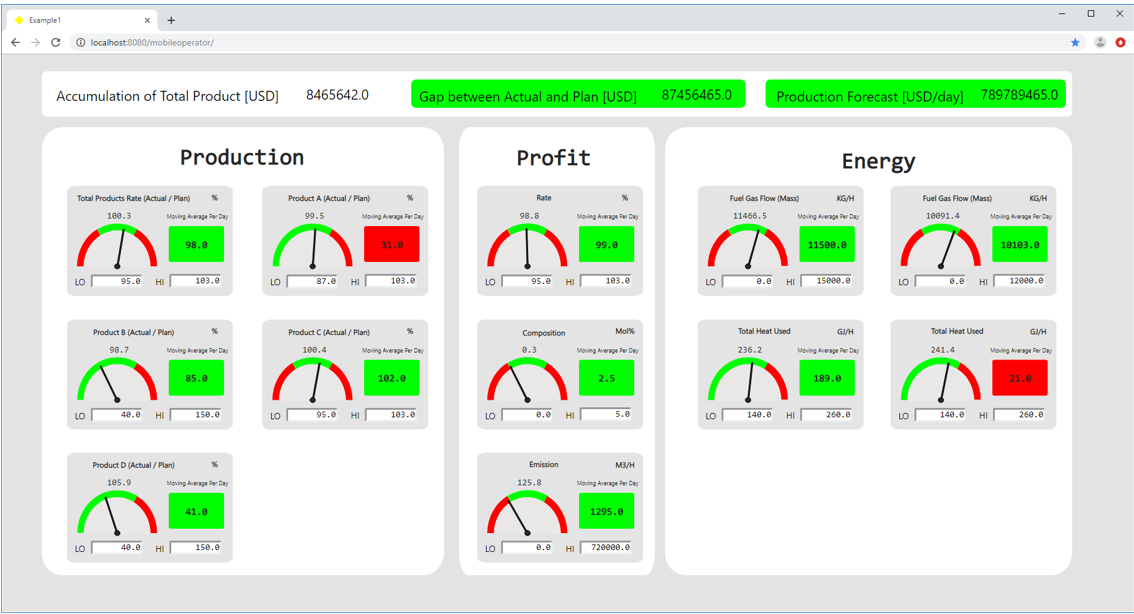
Figure-4: Leadership Dashboard
The Leadership Dashboard can be customized according to the preference of a user so that PDO can maximize the visualization effect of business-level KPIs.
The leadership KPIs are still mostly utilized as a weekly or monthly report, instead of a live trend. Therefore, the Leadership Dashboard is tailored based on its reporting purpose.

Figure-5: The Tree Dashboard, allocating correlating SPIs as a tree structure
This dashboard helps operators understand how their operation can contribute to management SPIs.
The frame color becomes red when a case-relevant SPI is in alarm mode. The combination of SPI alarms helps customers to identity the root cause of a performance issue by perceiving it as a pattern at a glance.
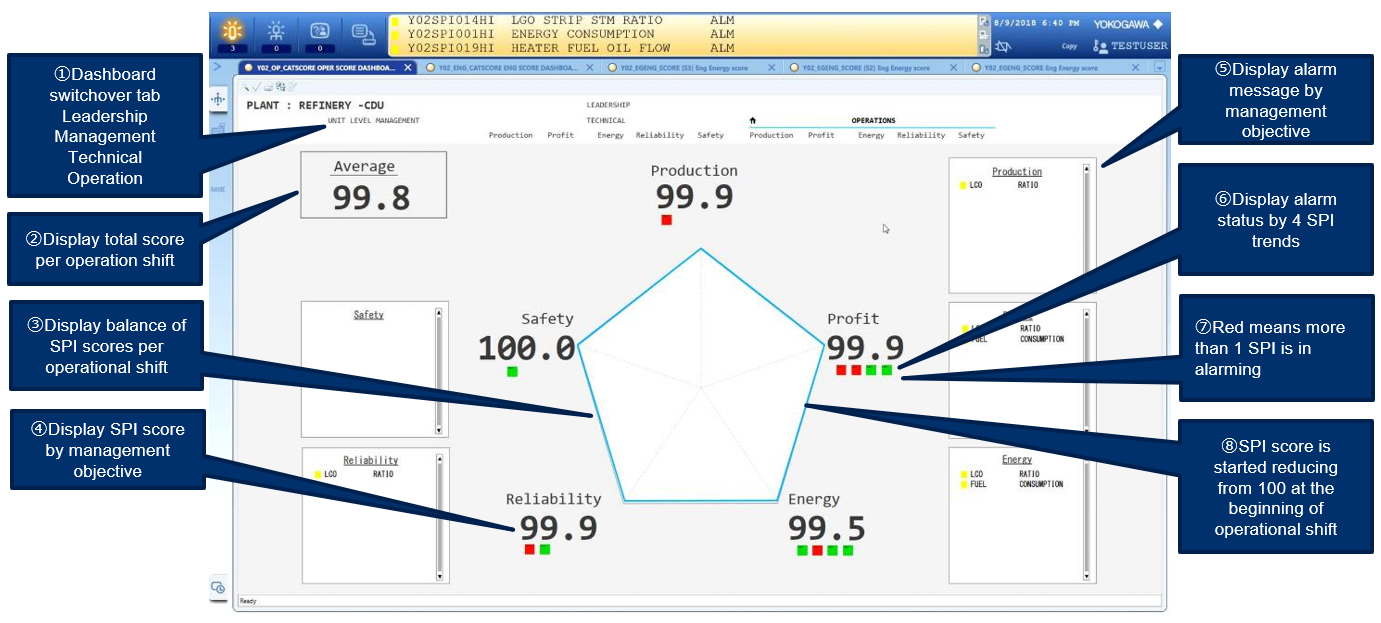
Figure-6: An example of the Balanced Score Dashboard
The Balanced Score Dashboard provides every functional role in a company, such as management, technical, and operations. Five management objectives are allocated with in a pentagon with its score. Customers can set High/Low operational limits for each SPI. An SPI alarm is activated when an SPI goes out of High/Low operational limits. While an SPI is in alarm mode, the score drops, and the pentagon shape also changes. The Balanced Score Dashboard helps customers to understand quickly whether the current operation is well-balanced or not by SPIs. The scoring function can help management to motivate engineers and operators for profit-driven operations.
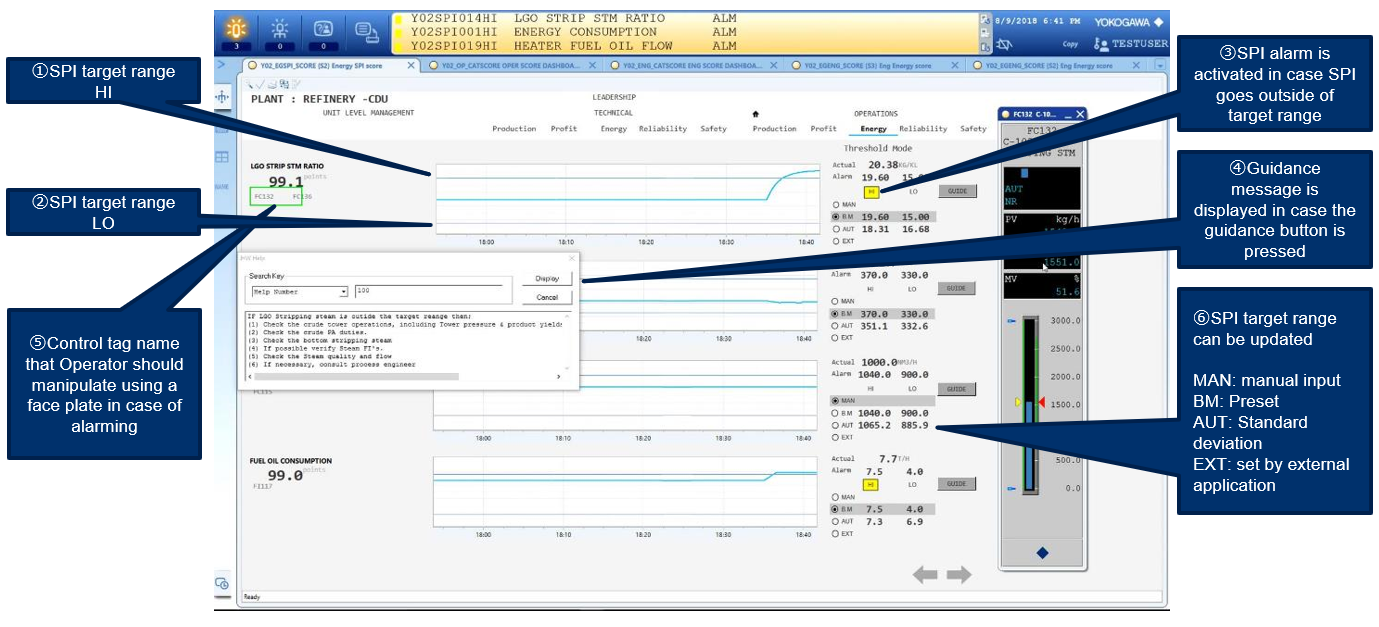
Figure-7: An example of a Trend Dashboard
Using the Trend Dashboard, the user can check the trend of each SPI.
Numbers 1 and 2 in the above figure shows the SPI target range. The operator can perceive his/her SPI range in the trend graph. If the process value crosses the given High/Low limitation, it sets off an alarm. Number 3 indicates the alarm mark. Each SPI has a guidance message, as is shown at number 4. It gives instruction, advice, and supportive information to operators so they can solve the cause of the alarm by themselves. Number 5 indicates the corresponding tags for the SPI. The operator can understand which tag is related with the SPI and can promptly take the required action. Number 6 explains four types of the High/Low target range. The 6-1, MAN range: the person who manages the target range can define it manually by writing the values on the screen, directly. The 6-2 BM range: it is a set of fixed High/Low values, but the user can discuss the benchmark range with Yokogawa. The 6-3 AUT range: the customer can set an automatic calculated range for each SPI, such as one or two sigmas, of normal distribution range of the process value to detect an abnormal situation.
The 6-4 EXT range: it is for using external values, and the High/Low range can be coupled with other data sources by using an OPC connection. For example, an optimized value from a process simulator can be a source of data for the High/Low range of a certain SPI.
With Yokogawa’s Solution, according to the case study, it is estimated that users can benefit generally, such as in the range of 1% to 10% of energy savings, 1% to 3% of production increase, and 1% to 2% of availability increase by actively utilizing Profit-driven Operation. Combining Yokogawa’s disruptive digital technology and industrial knowledge, Profit-driven Operation can derive digital transformation in a manufacturing plant’s operation.
For more information or inquiry, please contact the Profit-driven Operation team.<pdo@ml.jp.yokogawa.com>