

Introduction

Data analytics is popular nowadays especially in finance and retail industries. Many people even believe that data analysis is a do-or-die requirement in business today. In the process industry, there has been an explosion in the volume, velocity, and the variety of data. How to reduce operational risks and improve business performance by leveraging advanced data analytics (e.g. statistical analytics, predictive analytics, big data analytics, etc.) are extremely important questions that need to be considered, right now.
We are seeing an ever increasing amount of low cost competition from a variety of emerging markets that are placing downward pressure on margin. In addition, the industry is challenged with increasing consumer demands which push us to provide more stock keeping units, shorter product lifespans, and higher quality levels.
Risk is inherent in any business. Some of the risks like customer’s preference, competitive forces are very difficult to estimate and access. Such risks like operational risk can be well understood, recognized, and mitigated which can lead to achievements in operational excellence, higher margins, competitive advantages, and better customer relationships. Operational risks are related to five general aspects, which are: product quality, efficiency, asset reliability, safety, and human reliability. In this article, we will focus on how advanced data analytics can be used to provide further insights into the quality compliance.
Challenge in quality control
Recently, some companies have struggled with quality control problems, which results in wasting raw materials, recalls of products, and even damages to company reputation. The big questions that consumers ask are often:
“Why is it more and more difficulty to achieve the quality target?”
“How can we know that there is something wrong in advance, before shipping the product?”
We have seen two key challenges regarding aging assets and increases in demand for higher quality and consistency. The assets in many companies are getting old and becoming more unreliable. Therefore, it is more difficult to keep them optimized and improve the ability to achieve the quality targets. Another phenomenon we have found is the demand for quality and consistency that has never been achieved in the past. This is happening in the countries/regions such as Western Europe and Japan, both of which have already achieved top-levels in the industry, in terms of quality and consistency. In order to level up the quality, it requires companies to look into their database and check data for the entire manufacturing facility and all processes. However, it is really difficult to find all the parameters that influence the quality, because various factors were intricately involved. Many companies think they know all of the key variables that would affect their quality. But based on our experience, the reality is not ideal like that.So, we are left with a question:
How can we balance assets that are becoming older and more unreliable, with customer demands for improved quality and consistency, when there are so many hidden parameters that strongly influence quality?
Yokogawa quality stabilization solution
Through our past experience, Yokogawa has developed the quality stabilization solution – Process Data Analytics – that can detect a decline in quality or productivity at an early stage in the manufacturing process. This is made possible by analyzing process data, facility status information, operation history, and other data in the process. This solution focuses on the processing and adopts the structured methodology for identification, resolution and modeling of product quality problems based on the 4M concept of Machine, Materials, Method and Man (Figure 1).
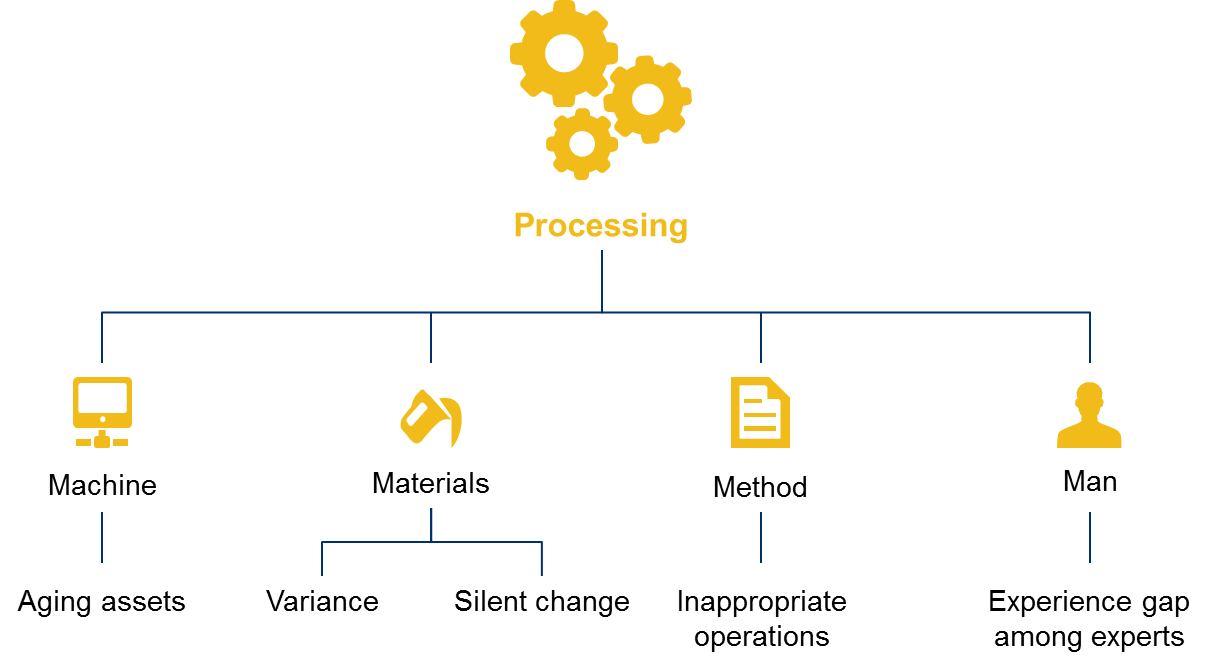
Figure 1: 4M methodology
Besides the methodology, we also develop the advanced data analytics software. This leading software uses the Mahalanobis Taguchi (MT) method for the analysis of multiple statistical variables. MT is a pattern recognition method that is widely used in quality control and quality management.
First, the standard space is generated from two or more data sets in normal state. Then, the compared data sets are collected from the data in compared state. The basic principle is to measure the distance between standard space and compared data sets, which is taking into account the correlations between the data sets. The normality or abnormality of the compared date set is judged by this distance called Mahalanobis Distance (Figure 2). And the deviation from normal conditions will be detected and it will trigger a warning that quality may have deteriorated.
In the process industry, particularly in the batch industry, a high degree of abnormality and extremely complex interrelationships exist. So far, we haven’t seen an early detection system in quality conducted to a level that operators will have the confidence to shutdown or adjust operations based on real-time quality detection, during production. Instead, our solution Process Data Analytics will analyze production operations by using the temperature, pressure, flow rate, liquid level, as well as other process data on facility operations and equipment maintenance collected by a plant information management system, DCS or PLC.
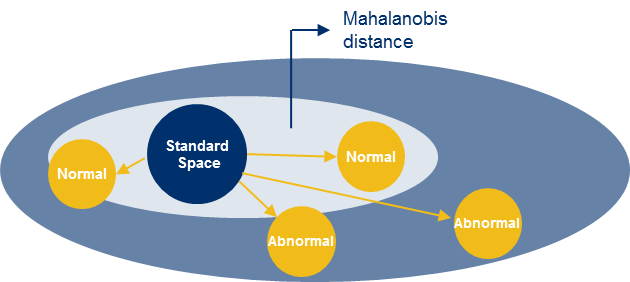
Figure 2: Mahalanobis Taguchi Method
Since quality is under the influence of various stakeholders, the key to the success of implementing this solution is to bring all members across several departments together and facilitate full cooperation with each other. However, in the market we find most data analytics companies only collect data and execute the analysis in-house without considering the customer's operation, which brings a lot of ignorance and leads to wrong conclusions.
Another common phenomenon is that the customers are given the data analytics software, but they are required to analyze the data by themselves. Usually software such as this is not user friendly and too complex for the average person to use. So after purchasing the software, the customers hardly use it. Yokogawa developed Process Data Analytics solution combining data analytics and the knowledge of plant operations. This unique solution requires us, as solutions experts, to work together with the customer and challenge them so that they eventually learn how to manage the quality issues themselves.
Many people have already realized that quality control is essential to building a successful business. We are all aware of the importance of the quality control at cost reduction and asset protection, but are these all of the benefits that quality can bring? Many companies, even the leaders in our industry will say 'yes'. The quality control functions are often perceived as overhead, and sometimes they are the targets for target cutting measures - “Quality control is nice and important, but it is not so attractive.” - Is it true? The following comments suggest otherwise:
“Companies that are perceived to have a higher quality product are three times more profitable than those are not.”
“Companies can boost profit by almost 100% by realizing only a 5% increase in customer retention”
The above findings are carried out by C.D. Heagy, who developed the study into intangible costs and their effects. The contributions of the quality control are underestimated or even ignored in terms of the revenue/profit generating and customer relationship improvement.
In one example, we cooperated with a tire company to help them to develop the optimal quality parameter design solution. Their quality target is difficult to achieve under the variation of the customer requirements. We propose the solution using a smooth response surface methodology to clarify the causal relationship between the quality and production conditions in a trade-off relationship. The execution of this analysis enables construction of a production system that can switch the production conditions with flexibility when there is a different requirement for the quality from their customer.
This analytical quality control solution helps our customer speed up the sales phase and increase the product competitiveness, ultimately boosting sales and profits.
General Approach
The Process Data Analytics consulting service was given to over 120 companies using the following general approach.
Step 1: Detailed site survey
Understand the process completely
Determine problems
Generate a hypothesis from the experiences
Collect the data (e.g. process data, quality data, operation/production/maintenance record, etc.)
Step 2: Pre-process data
Data cleaning
Extract features from the data (e.g. Figure 3)
Figure 3: Extract features (normal vs abnormal conditions)
Step 3: Statistical processing
Figure 4: Early detection of abnormality before the quality happens
Select the suitable methodology
Indexing of product quality
Anomaly detection/early detection (Figure 4)
Step 4: Root cause analysis
Investigate the root cause
Determine the root cause
Step 5: Report
Suggest countermeasures
Generate report
Conclusion
To conclude, the Process Data Analytics solution combines the advanced data analytics and the process know-how, which can help our customer stabilize and continuously improve the quality of their products.
This production quality control solution has been used in the oil, petrochemical, pulp and paper, iron and steel, pharmaceutical, food, automobile, glass, rubber, electrical equipment/electronics, and other industries. In general, it provides: Comprehensive methodologies, Advanced analytics software, and Skilled data analysts
Data analytics has been changing the world. We are trying our best to bring these amazing technologies to create a better life for our customer and society as a whole. Are you prepared to join us in this exploration??
Read our most recent articles, here. Press Release of Analytics Software, here.